View Managed Service Campaign performance
How-to | Last updated: 1/28/2026 | Learn how to view Managed Service Campaign performance
To see how your Managed Service Campaigns are performing, you can view measurement data in the Report Center.
View reports
-
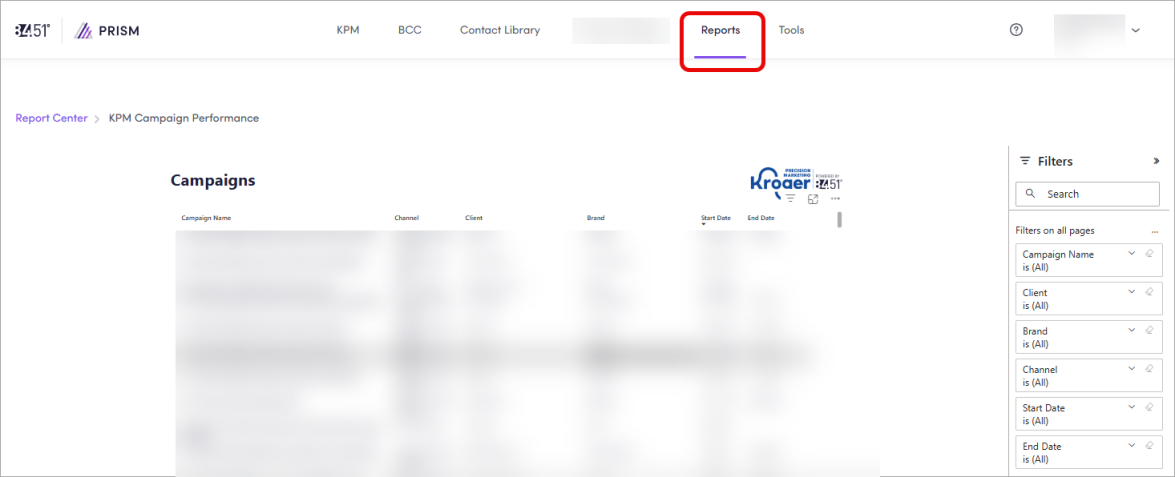
From 84.51° Prism, click Reports.
-
Click View Report on the KPM Kroger Precision Marketing Campaign Performance card.
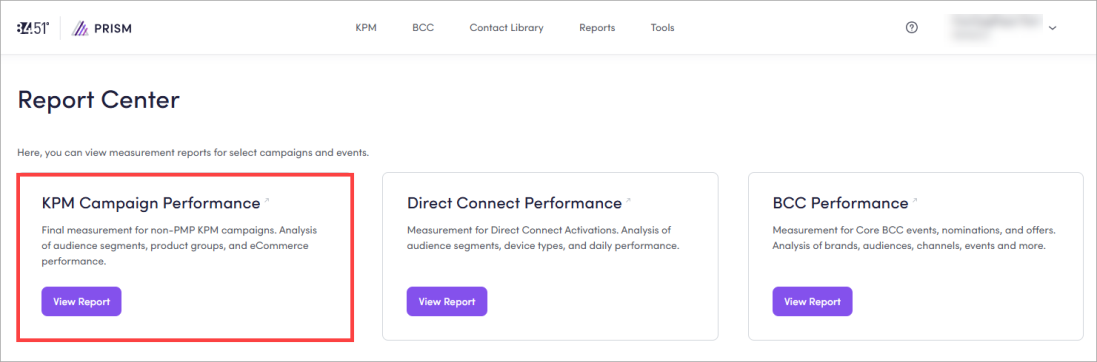
When the report loads, you'll see a list of all Managed Service Campaigns.
Customize reports
You can apply one or more filters like Campaign Name, Client, Brand, Channel, Start Date, and End Date.
You can also use keywords in the search bar to customize your reports.
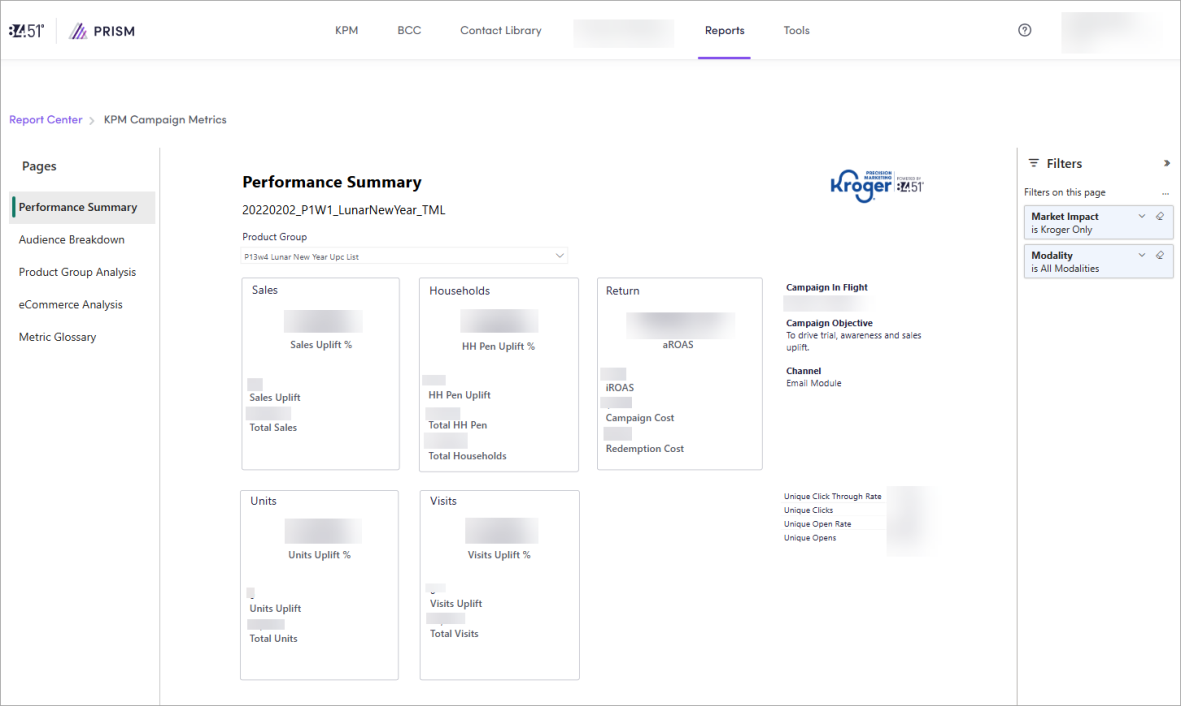
Find and select your Campaign to see the Performance Summary.
You can check this data every day and use it to analyze performance in real time while a Campaign is live.
This data can be used to optimize your current Campaign towards a selected key KPI Key Performance Indicator. Moreover, past Campaign data can be utilized to plan and optimize your next Campaign.
View specific data
You can navigate between pages to view specific data.
|
Page |
Description |
Instructions |
|---|---|---|
|
Performance Summary |
Shows overall performance of your Campaign |
You can also use the chart or the data table to identify the highest contributing UPCs Universal Product Codes by setting the Market Impact filter to Total Market. |
|
Audience Breakdown |
Shows a breakdown of how your Campaign performed by Audience Segments |
You can also analyze the contribution for those metrics to the entire Campaign performance by reviewing the donut chart and selecting a metrics from the slicer. |
|
Product Group Analysis |
Shows data on how each Product Group performed. This page is not affected by any other Product Group filters on other pages. |
|
|
eCommerce Analysis |
Shows data on what modalities customers are using by Product Group. |
|
|
Metric Glossary |
Shows definitions of all metrics used in KPM reports. |
Click Metric Glossary to access this page. To learn more, see Metrics. |
Visualize data
Within the report, you have a few options to visualize your data.
|
Option |
Instructions |
|---|---|
|
Focus mode |
Click Focus Mode ( |
|
Show as Table |
Click the ellipsis ( |
|
Spotlight |
Click the ellipsis ( |
|
Get insights |
Click the ellipsis ( |
 ) to expand a data table or chart.
Export (a specific chart or visual)
-
From the specific chart or visual, click the ellipsis (
 ), then Export Data.
 -
Export your data in the format that suits your needs.
If you have a lot of data, the number of rows you export might be limited depending on the file type you select.
Metrics
Each page of the report contains various metrics.
|
Metric |
Definition |
Calculation |
|---|---|---|
|
Attributable Return on Ad Spend; the total sales of the test group relative to the Total Campaign Cost as determined by the total sales for the products being measured. |
Total Sales / Total Spend |
|
|
Campaign Cost |
The cost associated with executing the Campaign, excluding Redemption Cost. |
— |
|
Click-Through Rate (CTR Clickthrough Rate) |
The total percentage of unique targeted households that clicked on the offer. |
— |
|
Delivery |
The reporting cut that only show sales metrics for purchases over the Delivery modality. |
— |
|
Download Rate |
The percentage of targeted households that downloaded the offer. |
Total Downloads / Total Households Identified |
|
Household Penetration Uplift |
Incremental Households; the increase in exposed households purchasing one (1) of the redemption products, above and beyond what would have been expected when compared to tightly-matched control households. |
Test Household Penetration - Control Household Penetration |
|
Household Penetration Uplift % |
Incremental Households Percentage; the percent increase in new redeeming households, above and beyond what would have been expected when compared to tightly-matched control households. |
Household Penetration Uplift / Control Household Penetration |
|
Household Penetration Rate |
Household Penetration; the percentage of exposed households in the Campaign who purchased the product within the attribution window. Shows the percentage of exposed households who are engaging with the brand and purchasing the product after seeing the creative. |
Total Households that purchased / Total Households exposed |
|
Impressions |
The total number of times an ad was served. |
— |
|
In Store |
The reporting cut that only show sales metrics for purchases over the In Store modality. |
— |
|
Incremental Return on Ad Spend; the total sales difference between test and control relative to the Total Campaign Cost as determined by the total Sales Uplift that was generated by households targeted for a Campaign |
(Total Test Group Sales - Total Control Group Sales) / Total Cost |
|
|
Market Impact |
Includes known Kroger sales, units and other metrics. Additionally, KPM leverages a consumer panel with known shopping behavior across many retailers to form a total projected market view of Kroger sales and multiple retailers. |
— |
|
Modality |
Describes the way in which households are shopping, whether In Store or via eCommerce. |
— |
|
Online |
The reporting cut that show sales metrics for purchases over both the Pickup and Delivery modalities. |
Pickup + Delivery |
|
Open Rate |
The total percentage of unique targeted households that received and opened an email for this Campaign. |
— |
|
Pickup |
The reporting cut that only show sales metrics for purchases over the Pickup modality. |
— |
|
Product Group |
A collection of product UPCs Universal Product Code being measured against for each coupon in the Campaign, entered during intake. To learn more, see Product Groups. |
— |
|
Redeemers |
The total number of unique targeted households that redeemed a coupon in the measurement group. |
— |
|
Redemption Cost |
Trade cost; the total dollar amount the redemptions accounted for which includes the eight (8) cent redemption processing fee. |
— |
|
Redemption Rate |
The total percentage of downloads that resulted in a redemption of one (1) or more products in the measurement group. |
Total Redemptions / Total Downloads |
|
Sales Uplift |
Incremental Sales; the increase in sales by targeted households, above and beyond what would have been expected when compared to tightly-matched control households. |
Test Household Spend - Control Household Spend |
|
Sales Uplift % |
Incremental Sales Percentage; the percent increase in sales by targeted households, above and beyond what would have been expected when compared to tightly-matched control households. |
Sales Uplift / Control Household Spend |
|
Total Clicks |
The total number of unique targeted households that clicked on the offer. |
— |
|
Total Downloads |
The total number of targeted households that downloaded a coupon associated with the Campaign. |
— |
|
Total Households |
The total number of households that were reached for the Campaign. |
— |
|
Total Household Penetration |
The total number of targeted households in the campaign who purchased the product within the campaign attribution window. Shows the total exposed households who are engaging with the brand and purchasing the product after seeing the creative. |
— |
|
Total Opens |
The total number of unique targeted households that received and opened an email for this Campaign. |
— |
|
Total Redemptions |
The total number of times that a coupon was redeemed in-store or online. |
— |
|
Total Sales |
The total attributable sales of the targeted test group (for the products being measured), with a 14-day lookback window for both in-store and online. |
— |
|
Total Units |
Total number of units within the measurement UPCs purchased by those in the test group. |
— |
|
Total Visits |
Total number of test household shopping trips that included at least one (1) of the measurement UPCs in the basket. |
— |
|
Units Uplift |
Incremental Units; the increase in total units purchased by targeted households, above and beyond what would have been expected when compared to tightly-matched control households. |
Test Household Units - Control Household Units |
|
Units Uplift % |
Incremental Units Percentage; the percent increase in units purchased by targeted households, above and beyond what would have been expected when compared to tightly-matched control households. |
Units Uplift / Control Household Units |
|
Visits Uplift |
Incremental Visits; the total number of baskets containing at least one (1) redemption product, above and beyond what would have been expected when compared to tightly-matched control households. |
Test Household Visits - Control Household Visits |
|
Visits Uplift % |
Incremental Visits Percentage; the percentage of total baskets containing at least one redemption product, above and beyond what would have been expected when compared to tightly-matched control households. |
Visits Uplift / Control Household Visits |
Cross-Channel Campaign report
If you're running a Cross-Channel Campaign, you may qualify for PrecisionView 360 measurement.
To learn more, see Cross-Channel Campaign reporting.
Related topics
Want to learn more about this topic? See these related topics:
Learn more
Explore other sections in the Learning Center to learn more about 84.51° Prism: