View Direct Connect Campaign performance
How-to | Last updated: 3/31/2026 | Learn how to view Direct Connect performance
Campaigns via The Trade Desk are moving to the Kroger Ad Platform.
To learn more, see Direct Connect - TTD in the Kroger Ad Platform Learning Center.
Any Campaigns for Direct Connect Meta must be activated and managed via the Kroger Ad Platform.
To learn more, see Direct Connect Meta in the Kroger Ad Platform Learning Center.
If you don't have access to the Kroger Ad Platform, contact your Account Management team.
To see how your Direct Connect Campaigns are performing, you can view measurement data in the Report Center.
View reports
-
From 84.51° Prism, click Reports.
-
Click View Report on the Direct Connect Campaign Performance card.
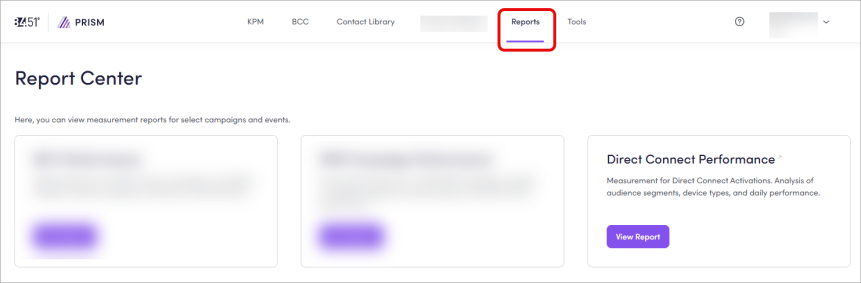
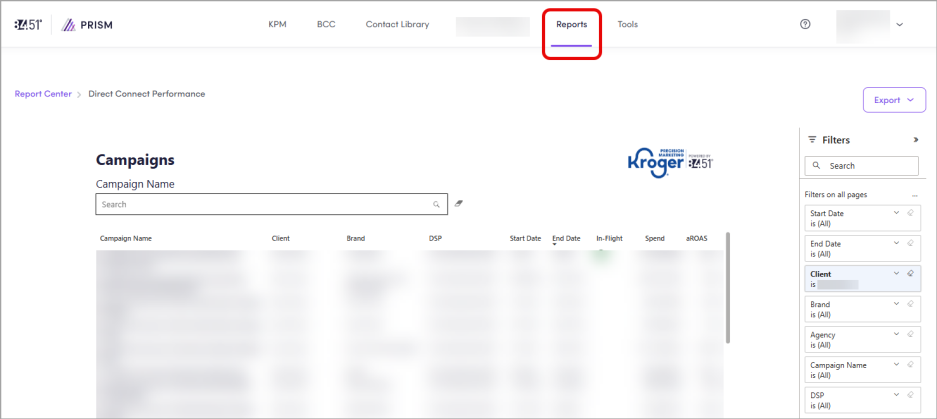
When the report loads, you'll see a list of all Direct Connect Campaigns, active and closed.
Campaigns via The Trade Desk are moving to the Kroger Ad Platform.
To learn more, see Direct Connect - TTD in the Kroger Ad Platform Learning Center.
Any Campaigns for Direct Connect Meta must be activated and managed via the Kroger Ad Platform.
To learn more, see Direct Connect Meta in the Kroger Ad Platform Learning Center.
If you don't have access to the Kroger Ad Platform, contact your Account Management team.
Customize reports
You can apply one (1) or more filters like Campaign Name, Client, Brand, Agency, DSP A system that allows buyers of digital advertising inventory to manage multiple ad exchange and data exchange accounts through one interface, Start Date, and End Date.
You can also use keywords in the search bar to customize your reports.
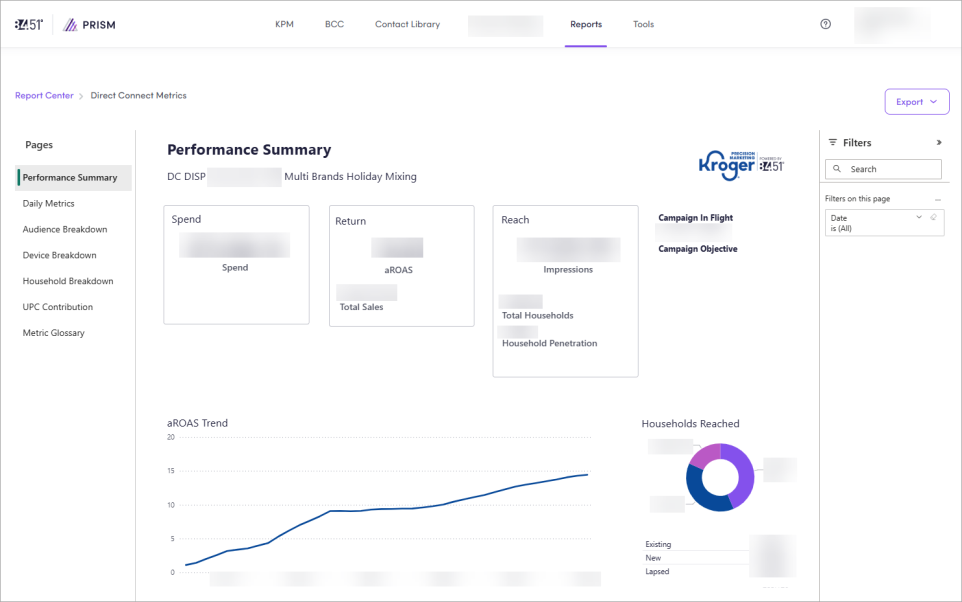
Find and select your Campaign to see the Performance Summary.
This data is updated daily and will continue to update until two (2) weeks after Campaign close, when the sales attribution window has closed.
There's no budget minimum for Direct Connect Campaigns. However, if you want iROAS Incremental Return on Ad Spend; the total sales difference between test and control relative to the total as determined by the total sales uplift generated by households targeted for the coupon. reporting, then you must spend at least $150K in Media.
You can access it at any time during Campaign flight and after your Campaign has closed.
This data can be used to optimize your current Campaign towards a selected key KPI Key Performance Indicator. Moreover, past Campaign data can be utilized to plan and optimize your next Campaign.
View specific data
You can navigate between pages to view specific data.
|
Page |
Description |
Instructions |
|---|---|---|
|
Performance Summary |
Shows overall performance of your Campaign. |
|
|
Daily Metrics |
Shows a daily breakdown from the beginning of the Campaign until the current date. |
|
|
Audience Breakdown |
Shows the aROAS trend for each Audience Segments you defined for your Campaign. |
|
|
Device Breakdown |
Shows Campaign performance with metrics and aROAS trend by device (mobile, tablet, and PC). |
|
|
Household Breakdown |
Show Campaign performance by household (New, Lapsed, and Existing). |
|
|
UPC Contribution |
Shows which UPCs Universal Product Codes contribute to the highest percentage of sales. |
|
|
Metric Glossary |
Shows definitions of all metrics used in Direct Connect reports. |
Click Metric Glossary to access this page. To learn more about each metric, see Metrics. |
Visualize data
Within the report, you have a few options to visualize your data.
|
Option |
Instructions |
|---|---|
|
Focus mode |
Click Focus Mode ( |
|
Show as Table |
Click the ellipsis ( |
|
Spotlight |
Click the ellipsis ( |
|
Get insights |
Click the ellipsis ( |
 ) to expand a data table or chart.
Export data
Export specific data
-
From the specific chart or visual, click the ellipsis (
 ), then Export Data.
 -
Export your data in the format that suits your needs.
If you have a lot of data, the number of rows you export might be limited depending on the file type you select.
Export all data
-
Click Export.
-
Use the dropdown to select either Export as .pptx (PowerPoint) or Export as .pdf (PDF).

Your final download includes one (1) page for each tab of your report, including visuals and filters, but not any raw data used to create the charts and tables.
Metrics
Each page of the report contains various metrics.
|
Metric |
Definition |
Calculation |
|---|---|---|
|
aROAS |
Attributable Return on Ad Spend; The total sales of the targeted test group (for the products being measured) related to the Total Spend. |
Total Sales / Total Spend |
|
Household Penetration Rate |
Percent of exposed households in the Campaign who purchased the product within the attribution window. Shows the percent of exposed households who are engaging with the brand and purchasing the product after seeing the creative. |
Total Households that have purchased / Total Households exposed |
|
New Households |
Shoppers who bought none of the submitted UPCs in the 52 weeks prior to campaign start. |
— |
|
Existing Households |
Shoppers who bought at least once in the 26 weeks prior to campaign start. |
— |
|
Lapsed Households Households that have not bought the promoted product in the latest 26 weeks |
Shoppers who bought at least once between 26-52 weeks prior to campaign start, but not between 0-26 weeks. |
— |
|
Rest of Market (ROM) |
Estimates the total market Sales Uplift (including non-Kroger stores) based on loyalty segments and Kroger share of wallet. |
— |
|
Total Households |
The total number of households that were reached for the Campaign. This number indicates how many unique Households were contacted. |
— |
|
Total Sales |
Total attributable sales of the targeted test group (for the products being measured), with a 14 day lookback window for both in-store and online. |
— |
|
Total Spend |
The dollar amount of the Total KPM Budget that has been spent so far. |
— |
|
Viewable Impressions |
The total number of times an ad was served, where at least 50% of the ad was visible for at least one second. |
— |
Cross-Channel Campaign report
If you're running a Cross-Channel Campaign, you may qualify for PrecisionView 360 measurement.
To learn more, see Cross-Channel Campaign reporting.